
In recent decades, climate change has emerged as one of the most pressing global challenges, driven primarily by the accumulation of greenhouse gases (GHGs) in the atmosphere due to human activities. Institutions of higher education, including universities, contribute to this environmental footprint through energy consumption, transporta- tion, waste generation, and other operational activities. As centers for research, innovation, and social transformation, universities not only consume substantial natural resources but also hold a unique responsi- bility to lead in sustainability and climate action. Quantifying and monitoring the carbon footprint of an academic institution is therefore a crucial step toward understanding its environmental impact and formu- lating effective mitigation strategies.
 A carbon footprint represents the total amount of GHG emissions—primarily carbon dioxide (CO₂), methane (CH₄), and nitrous oxide (N₂O)—produced directly or indirectly by an organization, activity, or product, expressed in tons of carbon dioxide equivalent (tCO₂e). Measuring institutional carbon foot- prints helps identify major emission sources, evaluate the effectiveness of energy management systems, and design policies to reduce overall emissions in alignment with national and global climate goals such as the Paris Agreement and Sustainable Development Goal 13 (Climate Action).
In the context of Bangladesh, where climate vulnerability is among the highest globally, assessing and managing carbon emissions is particularly critical. Universities such as Gazipur Agricultural Universi- ty (GAU) play a vital role in developing environmentally sustainable practices through research, educa- tion, and policy advocacy. However, data on the carbon emissions from academic institutions in Bangladesh remain scarce, limiting evidence-based planning for sustainability transitions.
This study presents a comprehensive carbon footprint assessment of GAU for the year 2024, follow- ing the Greenhouse Gas Protocol (GHGP) framework, which categorizes emissions into three scopes:
• Scope 1 (Direct emissions): from fuel combustion, generators, laboratory activities, and livestock operations.
• Scope 2 (Indirect emissions): from purchased electricity consumption.
• Scope 3 (Other indirect emissions): from activities such as transportation, air travel, and waste man- agement.
The primary objectives of this assessment were to:
1. Quantify the total GHG emissions generated by GAU under each scope.
2. Identify major emission sources contributing to the institutional carbon footprint.
3. Provide baseline data to support mitigation and sustainability initiatives within the university.
Through this analysis, GAU aims to integrate carbon accounting into institutional decision-making, enhance energy efficiency, and foster low-carbon campus development. The findings of this study are expected to guide university administrators and policymakers in adopting targeted interventions such as renewable energy expansion, sustainable transportation planning, and waste management optimization. Ultimately, this initiative aligns with the Government of Bangladesh’s commitment to reducing carbon emissions and advancing towards a green, climate-resilient economy, reinforcing the university’s leader- ship in environmental stewardship and sustainable agricultural innovation.
Table 1: Scope wise carbon footprint January 2024-December 2024
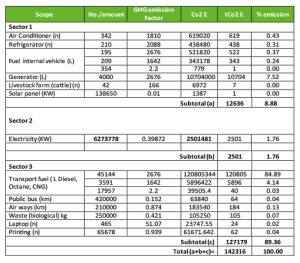
The table summarizes the total greenhouse gas (GHG) emissions from Gazipur Agricultural University (GAU) under three emission scopes as defined by the Greenhouse Gas Protocol (GHGP).
• Scope 1 (Direct Emissions):
Includes emissions from sources directly owned or controlled by the university, such as air conditioners,refrigerators, fuel used in internal vehicles, generators, and livestock farming. The total direct emission was 12,636 tCO2e, contributing 8.88% of total institutional emissions. The highest emitter within this category was fuel use in generators (7.52%), followed by air conditioners (0.43%) and refrigerators (0.31%).
• Scope 2 (Indirect Emissions):
Represents emissions from purchased electricity. The total electricity consumption was 6,273,778 kWh,which produced 2,501 tCO2e, accounting for 1.76% of total emissions. This relatively lower contribution reflects the increasing use of energy-efficient systems and solar installations on campus.
• Scope 3 (Other Indirect Emissions):
Covers emissions from activities not directly controlled by GAU but related to its operation, such as
transportation, air travel, waste management, and office equipment use. Scope 3 contributed the highest proportion (89.36%), equivalent to 127,179 tCO2e. Major contributors include transport fuel consumption (84.89%), student and staff commuting (4.14%), and air travel (0.13%).The overall institutional carbon footprint for 2024 was 142,316 tCO2e, indicating the significant impact of transportation-related emissions compared to direct campus sources.
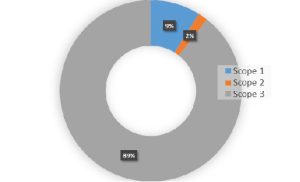
The pie chart clearly demonstrates that Scope 3 emissions overwhelmingly dominate the carbon footprint profile, accounting for nearly nine-tenths (89%) of total GHG emissions. In contrast, Scope 1 and Scope 2 contributed 8.88% and 1.76%, respectively. This trend indicates that indirect emissions -particularly from transport and supply-chain activities – are the most significant contributors to GAU’s overall environmental impact.
This finding suggests that mitigation strategies should prioritize reducing transport-related emissions,
promoting electric mobility, and optimizing institutional logistics and procurement systems to minimize indirect carbon loads.
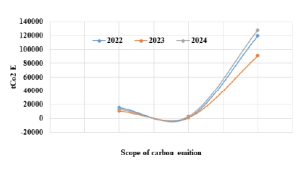
Scope-Wise Comparisons of Carbon Footprint at GAU over the period
The bar graph compares emissions across the three scopes over three consecutive years. While Scope 1 and 2 emissions remained relatively stable or showed slight increases due to infrastructure expansion, Scope 3 emissions exhibited a noticeable rise in 2024, primarily attributed to increased travel and fuel consumption associated with post-pandemic academic and research activities.
The trend underscores the need for sustainable commuting programs, virtual meeting adaptation and green procurement policies to curb indirect emissions as campus activities normalize.
Fig 2. Scope wise comparisons of carbon footprints at GAU in 2022 to 2024
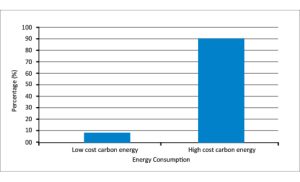
Low carbon energy use in GAU
This figure illustrates the composition of energy consumption sources within the university, highlighting the growing integration of low-carbon and renewable energy systems, such as solar panels, contributing to emission reduction under Scope 2. Despite the dominance of conventional grid electricity, the gradual increase in solar energy utilization indicates GAU’s commitment to sustainable energy transition.
Further expansion of solar capacity and energy-efficient systems could significantly lower overall elec- tricity-related emissions in future assessments